In this blog post, we'll explore how to create a custom decorator for timing function execution and how to upload the collected statistics to a MySQL database. We'll break down the code into smaller parts and explain each section.
Part 1: Creating a Static Variable Decorator
First, let's look at the `static_vars` decorator:
def static_vars(**kwargs):
    def decorate(func):
        for k in kwargs:
            setattr(func, k, kwargs[k])
        return func
    return decorate
This decorator allows us to add static variables to a function. It takes keyword arguments and sets them as attributes of the function.
Part 2: The Timing Decorator
Next, we'll examine the `timing` decorator:
@static_vars(data={}, lock=threading.RLock())
def timing(f):
    @wraps(f)
    def wrap(*args, **kw):
        ts = time.time()
        result = f(*args, **kw)
        te = time.time()

        with timing.lock:
            name = f.__module__ + '::' + f.__name__
            fd = timing.data.get(name, {})
            fd['count'] = fd.get('count', 0)+1
            fd['time'] = fd.get('time', 0) + te-ts
            fd['last'] = te-ts
            timing.data[name] = fd

        return result
    return wrap
This decorator does the following:
- Uses `static_vars` to create a `data` dictionary and a `lock` for thread safety.
- Wraps the original function to measure its execution time.
- Stores the execution statistics in the `data` dictionary.
How to Use the Timing Decorator
To use the timing decorator, simply apply it to any function you want to measure:
@timing
def my_function():
    # Your function code here
    pass
The decorator will automatically collect timing statistics for this function.
Part 3: Creating the MySQL Table
To store the function execution statistics, create the `function_statistics` table in your MySQL database.
CREATE TABLE function_statistics (
    id INT AUTO_INCREMENT PRIMARY KEY,
    function_name VARCHAR(255) NOT NULL,
    iteration INT NOT NULL DEFAULT '0',
    call_count INT NOT NULL DEFAULT '0',
    total_time DOUBLE(10,6) DEFAULT '0.000000',
    average_time DOUBLE(10,6) GENERATED ALWAYS AS ((total_time / nullif(call_count,1))) VIRTUAL
    created_at TIMESTAMP DEFAULT CURRENT_TIMESTAMP
);

-- Create an index on function_name
CREATE INDEX idx_function_name ON function_statistics (function_name);

-- Create an index on iteration
CREATE INDEX idx_iteration ON function_statistics (iteration);

-- Create a composite index on both function_name and iteration
CREATE INDEX idx_function_name_iteration ON function_statistics (function_name, iteration);
This table structure includes:
- `average_time`: A virtual column that automatically calculates the average execution time per function call.
- with this new column, you can easily query the average execution time for functions.
- by adding this virtual column, you've made it much easier to analyze the performance of your functions over time
To get the average execution time for the last 10 iterations of a specific function:
SELECT function_name, iteration, average_time
FROM function_statistics
WHERE function_name = 'your_function_name'
ORDER BY iteration DESC
LIMIT 10;
To get the top 5 functions with the highest average execution time across all iterations:
SELECT function_name, AVG(average_time) AS overall_average_time
FROM function_statistics
GROUP BY function_name
ORDER BY overall_average_time DESC
LIMIT 5;
To determine the slope and intercept, which indicate whether the function's time increases over a period, we can create an SQL query to compute these metrics. The slope shows "how much it has increased," while the intercept can be interpreted as the baseline time of the function.
WITH function_stats AS (
    SELECT
        function_name,
        COUNT(*) AS n,
        SUM(iteration) AS sum_x,
        SUM(average_time) AS sum_y,
        SUM(iteration * iteration) AS sum_xx,
        SUM(iteration * average_time) AS sum_xy
    FROM
        function_statistics
    GROUP BY
        function_name
),
regression_calc AS (
    SELECT
        function_name,
        n,
        sum_x,
        sum_y,
        (n * sum_xy - sum_x * sum_y) / (n * sum_xx - sum_x * sum_x) AS slope
    FROM
        function_stats
)
SELECT
    function_name,
    slope,
    (sum_y - slope * sum_x) / n AS intercept
FROM
    regression_calc;
Part 4: Uploading Function Statistics
Finally, let's look at the function that uploads the collected statistics to the database:
def upload_function_statistics(config, connection, cursor):
    with timing.lock:
        try:
            cursor.executemany(
                """
                INSERT INTO function_statistics
                    (function_name, iteration, call_count, total_time)
                VALUES
                    (%s, %s, %s, %s)
                """,
                [
                    (k, config.pdb.iteration, v['count'], v['time'])
                    for k,v in timing.data.items()
                ]
            )
            connection.commit()
        except Exception as e:
            error_ref = 'Q987pp'
            handle_error('upload_function_statitics', e, error_ref)

        # reset counter
        timing.data = {}
This function:
- Uses a lock to ensure thread safety.
- Inserts the collected statistics into the `function_statistics` table.
- Handles any exceptions that occur during the upload process.
- Resets the statistics counter after uploading.
You can create a separate process or thread that runs continuously and calls upload_function_statistics at regular intervals :
import threading
import time

def periodic_upload():
    iteration = 0
    while True:
        upload_function_statistics(iteration, db_connection, db_cursor)
        time.sleep(10)
        iteration += 1

upload_thread = threading.Thread(target=periodic_upload)
upload_thread.start()
Part 5: Visualizing Function Performance Statistics with PHP and Plotly.js
The core of this visualization is the `showFunctionCurves` function. Here's a breakdown of its functionality:
- **Color Palette**: A predefined color palette is used to ensure consistent colors for each function across different charts.
- **Database Query**: It fetches the most recent 5000 data points for functions that meet a minimum performance threshold.
- **Data Processing**: The fetched data is processed into a format suitable for Plotly.js.
- **Trace Generation**: Each function's data is converted into a "trace" for the Plotly chart.
- **Chart Generation**: It generates the HTML and JavaScript code for the Plotly chart.
The `showFunctionCurves` Function:
function showFunctionCurves($db_connection, $column, $minimum, &$colors) {
    // Define a fixed color palette
    $color_palette = [
        '#FF5733', '#3357FF', '#A133FF', '#FF00FF',
        '#FF0000', '#0000FF', '#3366FF', '#000000',
        '#800000', '#008000', '#000080', '#808000',
        '#800080', '#008080',
    ];


    // Fetch data from the database
    $query = "
        WITH RankedStatistics AS (
            SELECT
                fs1.function_name,
                fs1.iteration,
                fs1.".$column.",
                ROW_NUMBER() OVER (PARTITION BY fs1.function_name ORDER BY fs1.iteration DESC) AS rn
            FROM
                function_statistics AS fs1
            WHERE
                fs1.function_name IN (
                    SELECT
                        fs2.function_name
                    FROM
                        function_statistics AS fs2
                    WHERE
                        fs2.".$column." > ".$minimum."
                    GROUP BY
                        fs2.function_name
                )
        )
        SELECT
            function_name,
            iteration,
            ".$column."
        FROM
            RankedStatistics
        WHERE
            rn <= 5000
        ORDER BY
            function_name, iteration;
    ";

    $result = mysqli_query($db_connection, $query);

    if (!$result) {
        die("Query failed: " . mysqli_error($db_connection));
    }

    // Process the data
    $data = [];
    while ($row = mysqli_fetch_assoc($result)) {
        $data[$row['function_name']][] = [
            'x' => $row['iteration'],
            'y' => $row[$column],
        ];
    }

    $function_names = array_keys($data);
    foreach ($function_names as $index => $function_name) {
        if (!array_key_exists($function_name, $colors)) {
            //$colors[$function_name] = sprintf('#%06X', mt_rand(0, 0xFFFFFF));
            $colors[$function_name] = $color_palette[$index % count($color_palette)];
        }
    }

    // Prepare the traces for Plotly.js
    $traces = [];
    foreach ($data as $function_name => $points) {
        $x = array_column($points, 'x');
        $y = array_column($points, 'y');
        $traces[] = [
            'x' => $x,
            'y' => $y,
            'mode' => 'lines',
            'name' => $function_name,
            'line' => ['color' => $colors[$function_name]],
            'hovertemplate' =>
                '<span style="font-weight:bold;color:' . $colors[$function_name] . '">%{fullData.name}</span><br>' .
                '<span style="display: flex; justify-content: space-between; width: 100%;">' .
                '<span>Iteration: %{x}</span>' .
                '<span style="margin-left:20px;;">'.$column.': %{y:.2f}</span>' .
                '</span>' .
                '<extra></extra>'
        ];
    }

    // Generate the HTML and JavaScript for the chart
    $chart_id = 'functionPerformanceChart-'.$column;
    $html = "<div id='$chart_id' style='width:100%;height:400px;'></div>";
    $js = "
    <script src='https://cdn.plot.ly/plotly-latest.min.js'></script>
    <script>
    document.addEventListener('DOMContentLoaded', function() {
        var data = " . json_encode($traces) . ";
        var layout = {
            title: 'Function Performance Over Iterations',
            xaxis: {
                title: 'Iteration'
            },
            yaxis: {
                title: '" . ucfirst(str_replace('_', ' ', $column)) . " (seconds)'
            },
            hoverlabel: {
                bgcolor: '#FFF',
                bordercolor: '#000',
                font: {
                    size: 12,
                    color: '#000'
                },
                align: 'left'
            },
            hovermode: 'closest'
        };
        var config = {
            responsive: true
        };
        Plotly.newPlot('$chart_id', data, layout, config);
    });
    </script>";

    return $html . $js;
}
- A predefined color palette for consistent function colors
- Database querying for recent performance data
- Data processing for Plotly.js format
- Generation of HTML and JavaScript for the charts
Using the `showFunctionCurves` Function :
<?php
$colors = [];
echo showFunctionCurves($db_connection, 'average_time', 1.0, $colors);
echo showFunctionCurves($db_connection, 'total_time', 5.0, $colors);
echo showFunctionCurves($db_connection, 'call_count', 100, $colors);
?>
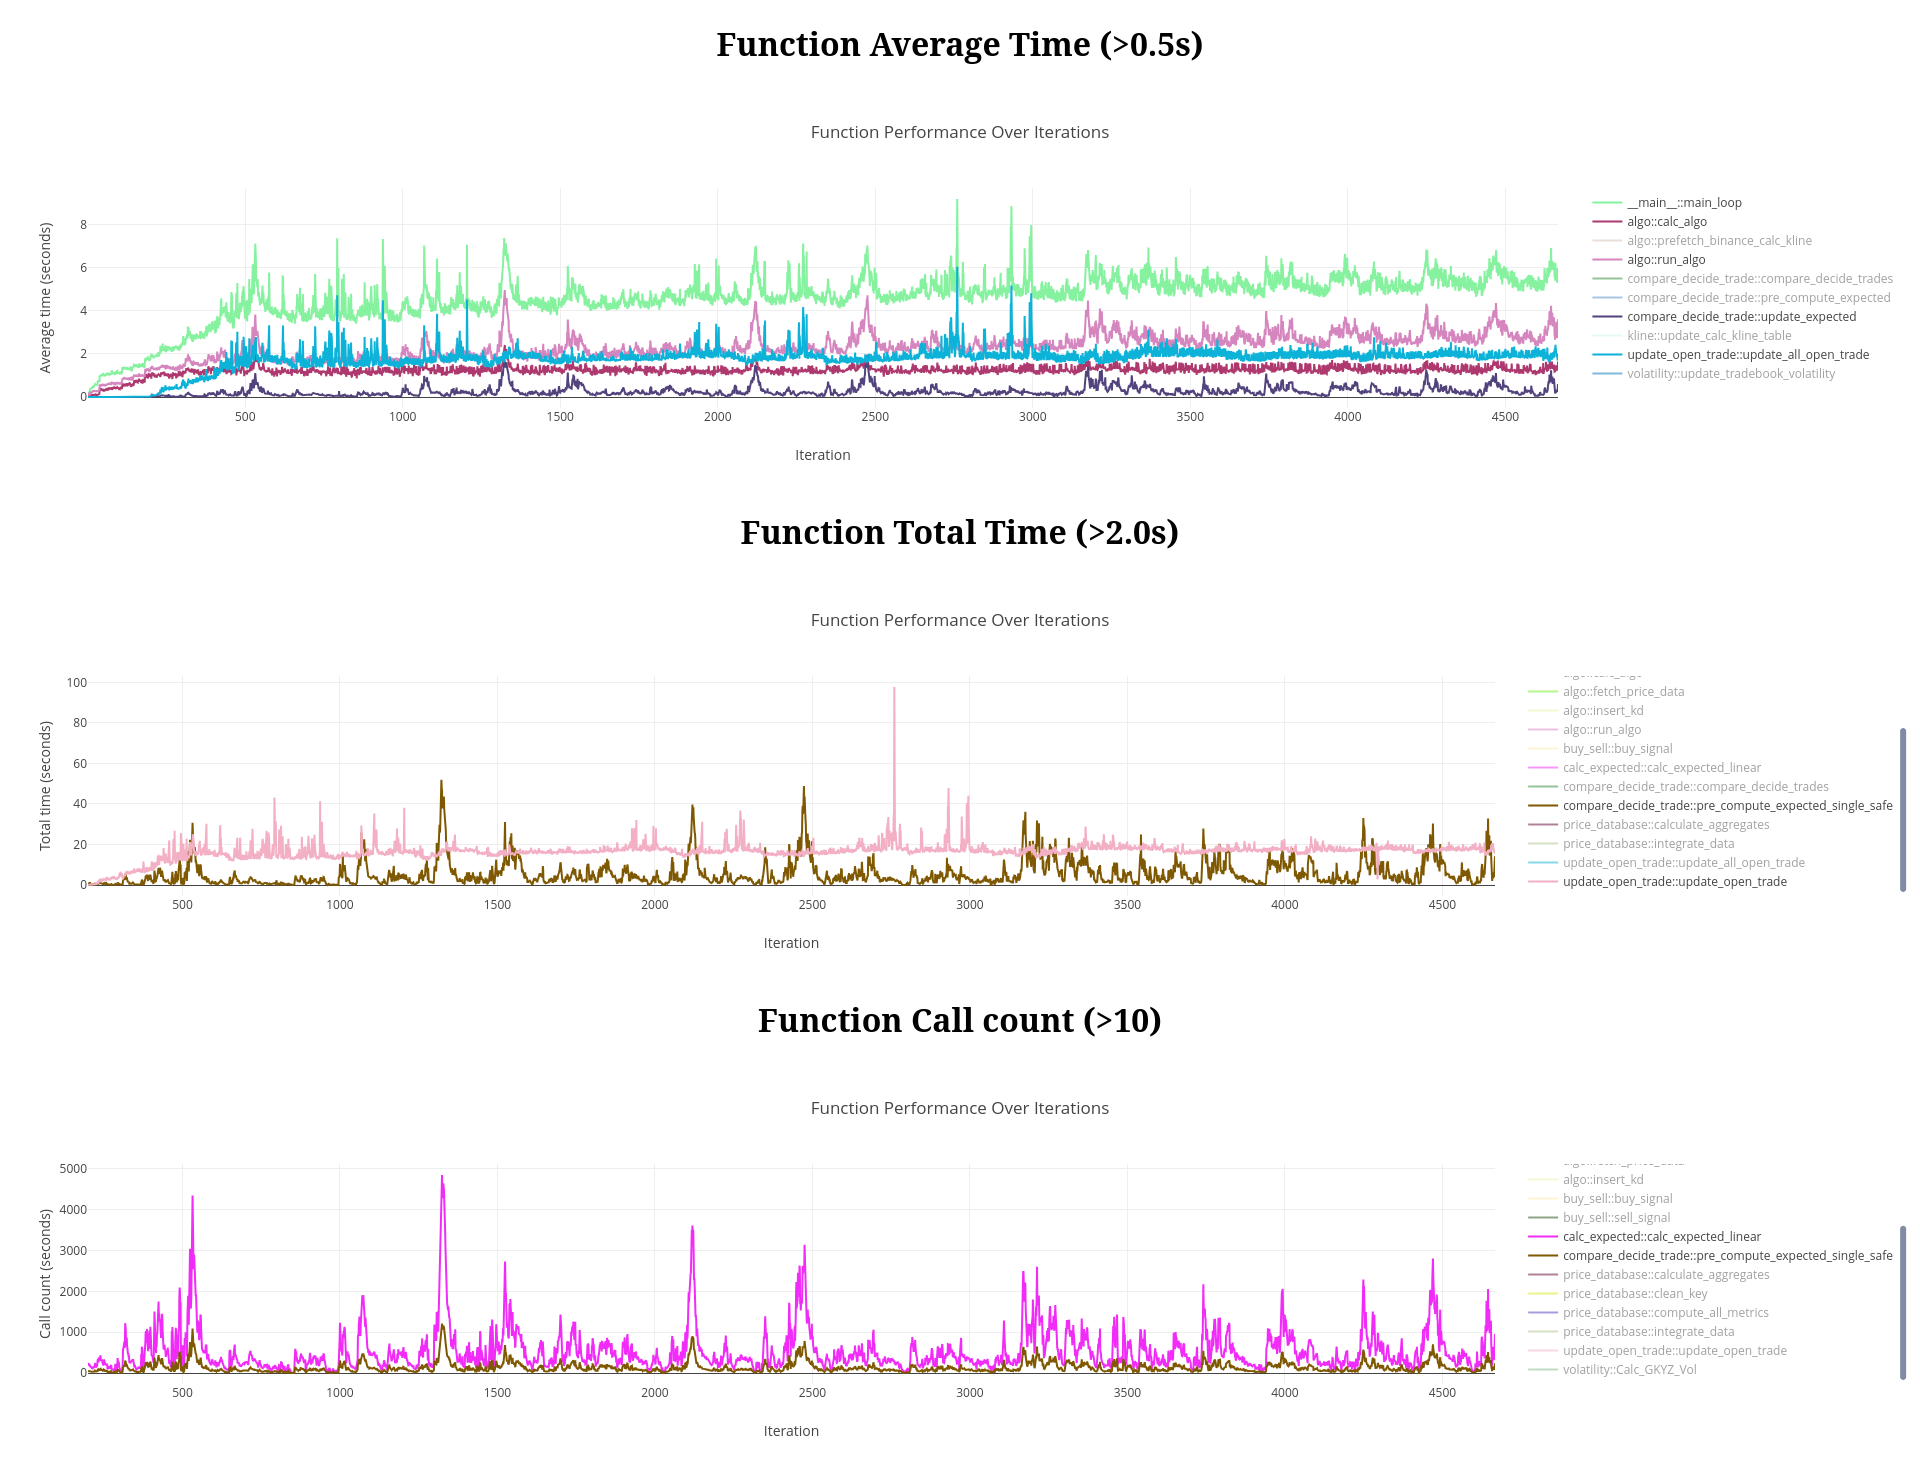
This code creates three charts:
- Average execution time for functions taking more than 1 second.
- Total execution time for functions taking more than 5 seconds.
- Call count for functions called more than 100 times.
This tutorial provides a comprehensive system for timing function execution, storing performance data, and visualizing it with interactive charts. By integrating this visualization with the function timing system we built earlier, you now have a powerful tool to monitor and analyze the performance of your functions over time, helping you identify performance bottlenecks and track improvements.
Part 6 Further improvement :
In the same idea, a decorator with a try-catch mechanism can be defined to encapsulate the function call and save exceptions into a data dictionary.
The idea is simply to make any function totally safe to be called, if that function return an Exception type, then something went wrong during the execution, but it should be managed.
@static_vars(data={}, lock=threading.RLock())
def exception_logger(f):
    @wraps(f)
    def wrap(*args, **kw):
        try:
            return f(*args, **kw)
        except Exception as e:
            with exception_logger.lock:
                name = f.__module__ + '::' + f.__name__
                fd = exception_logger.data.get(name, [])
                fd.append({
                    'exception': str(e),
                    'args': args,
                    'kwargs': kw,
                    'time': time.time()
                })
                exception_logger.data[name] = fd
            return e
    return wrap
In all cases Exception are saved into the data dict, and can be stored in a MySQL database :
CREATE TABLE function_exceptions (
    id INT AUTO_INCREMENT PRIMARY KEY,
    function_name VARCHAR(255) NOT NULL,
    iteration INT NOT NULL DEFAULT '0',
    exception TEXT NOT NULL,
    args TEXT,
    kwargs TEXT,
    created_at TIMESTAMP DEFAULT CURRENT_TIMESTAMP
);

-- Create an index on function_name
CREATE INDEX idx_function_name ON function_exceptions (function_name);

-- Create an index on iteration
CREATE INDEX idx_iteration ON function_exceptions (iteration);

-- Create a composite index on both function_name and iteration
CREATE INDEX idx_function_name_iteration ON function_exceptions (function_name, iteration);
import json

def serialize_safely(obj):
    try:
        return json.dumps(obj)
    except (TypeError, OverflowError):
        return str(obj)

def upload_exception_statistics(iteration, connection, cursor):
    with exception_logger.lock:
        try:
            data_to_insert = []

            for k, exceptions in exception_logger.data.items():
                for ex in exceptions:
                    serialized_exception = serialize_safely(ex['exception'])
                    serialized_args = serialize_safely(ex['args'])
                    serialized_kwargs = serialize_safely(ex['kwargs'])
                    data_to_insert.append((k, iteration, serialized_exception, serialized_args, serialized_kwargs, ex['time']))

            cursor.executemany(
                """
                INSERT INTO function_exceptions
                    (function_name, iteration, exception, args, kwargs, created_at)
                VALUES
                    (%s, %s, %s, %s, %s)
                """,
                data_to_insert
            )
            connection.commit()
        except Exception as e:
            logger.error(f"Error uploading exception statistics: {str(e)}", exc_info=True)
        finally:
            # reset counter
            exception_logger.data = {}
Gluing with hot code reloading :
import os
import importlib

def hot_reload(func):
    def wrapper(*args, **kwargs):
        module = importlib.import_module(func.__module__)
        if hasattr(module, '_last_modified') and os.path.getmtime(module.__file__) > module._last_modified:
            importlib.reload(module)
            module._last_modified = os.path.getmtime(module.__file__)
        return getattr(module, func.__name__)(*args, **kwargs)
    return wrapper


# Combine all decorators
def super_decorator(func):
    @hot_reload
    @exception_logger
    @timing
    @wraps(func)
    def wrapper(*args, **kwargs):
        return func(*args, **kwargs)
    return wrapper
import threading
import time

# Example function using the combined decorator
@super_decorator
def example_function(x, y):
    """An example function that might be modified during runtime."""
    result = x / y
    time.sleep(0.1)  # Simulate some work
    return result

# File change handler for hot reloading
class ModuleReloadHandler(FileSystemEventHandler):
    def on_modified(self, event):
        if event.src_path.endswith('.py'):
            print(f"File {event.src_path} has been modified. Hot reloading...")

def periodic_upload():
    iteration = 0
    while True:
        upload_function_statistics(iteration, db_connection, db_cursor)
        upload_exception_statistics(iteration, db_connection, db_cursor)
        time.sleep(10)
        iteration += 1

# Main execution
if __name__ == "__main__":
    # Set up file watcher for hot reloading
    event_handler = ModuleReloadHandler()
    observer = Observer()
    observer.schedule(event_handler, path='.', recursive=False)
    observer.start()

    upload_thread = threading.Thread(target=periodic_upload)
    upload_thread.start()

    while True:
        result = example_function(10, 2)
        print(f"Result: {result}")

    observer.join()