Page 3 of 4
Exmple de scatter plot
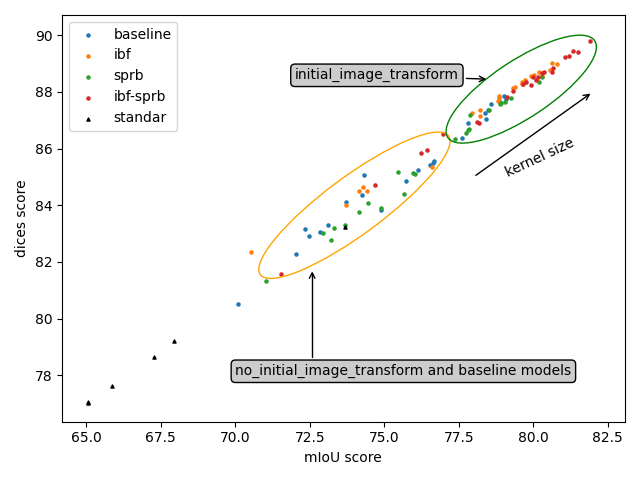
import numpy as np
import matplotlib.pyplot as plt
import pandas as pd

from matplotlib.patches import Ellipse
import matplotlib.transforms as transforms

def draw_ellipse(x, y, sx, sy, rot, facecolor='none', **kwargs):
    ellipse = Ellipse((x, y),
        width=sx, height=sy,
        angle=rot, facecolor=facecolor,
        **kwargs)
    return ax.add_patch(ellipse)

standar = pd.read_csv('all_fixed.csv')
dices = pd.read_csv('all_cnn_model-dice.csv')
mIoUs = pd.read_csv('all_cnn_model-mean_iou.csv')

Dices = np.array(dices)
MIoUs = np.array(mIoUs)
Standar = np.array(standar)

Merged = np.hstack([MIoUs, Dices[:,1:]])

fig, ax = plt.subplots()

for i,t in enumerate(['baseline', 'ibf', 'sprb', 'ibf-sprb']):
    ax.scatter(Merged[:-2,i+1], Merged[:-2,i+5], label=t, s=5)
    #for j in range(Merged.shape[0]):
     #   ax.annotate(Merged[j,0], (Merged[j,i+1], Merged[j,i+5]))

ax.scatter(Standar[:-2,1], Standar[:-2,2], label='standar', s=5, c='black', marker="^")

draw_ellipse(74.0, 84.0, 2, 8, -52, edgecolor='orange')
draw_ellipse(79.6, 88.1, 2, 6, -55, edgecolor='green')

ax.annotate("", xy=(82, 88), xytext=(78, 85), arrowprops=dict(arrowstyle="->"))
ax.annotate("kernel size", xy=(82, 88), xytext=(79, 85), rotation=25)


ax.annotate('no_initial_image_transform and baseline models',
            xy=(72.58, 81.77), xycoords='data',
            xytext=(70.00, 78.0),
            bbox=dict(boxstyle="round", fc="0.8"),
            arrowprops=dict(arrowstyle="->",
            connectionstyle="angle,angleA=0,angleB=90,rad=10"))

ax.annotate('initial_image_transform',
            xy=(78.52, 88.45), xycoords='data',
            xytext=(72.00, 88.45),
            bbox=dict(boxstyle="round", fc="0.8"),
            arrowprops=dict(arrowstyle="->"))

plt.xlabel('mIoU score')
plt.ylabel('dices score')
plt.legend()
plt.tight_layout()
plt.show()